
Michael Burry built his reputation on reading the footnotes other people skip. So when he spends months reading more than a thousand annual reports and emerges saying that a decade of Big Tech profits has been overstated by $1.7 trillion, it’s worth understanding exactly what he means — because the mechanism is real, mundane, and hiding in plain sight on every earnings call. Here’s what the number actually is, why it’s not the headline you’ve seen, and how to read tech earnings differently because of it.
What did Michael Burry actually claim?
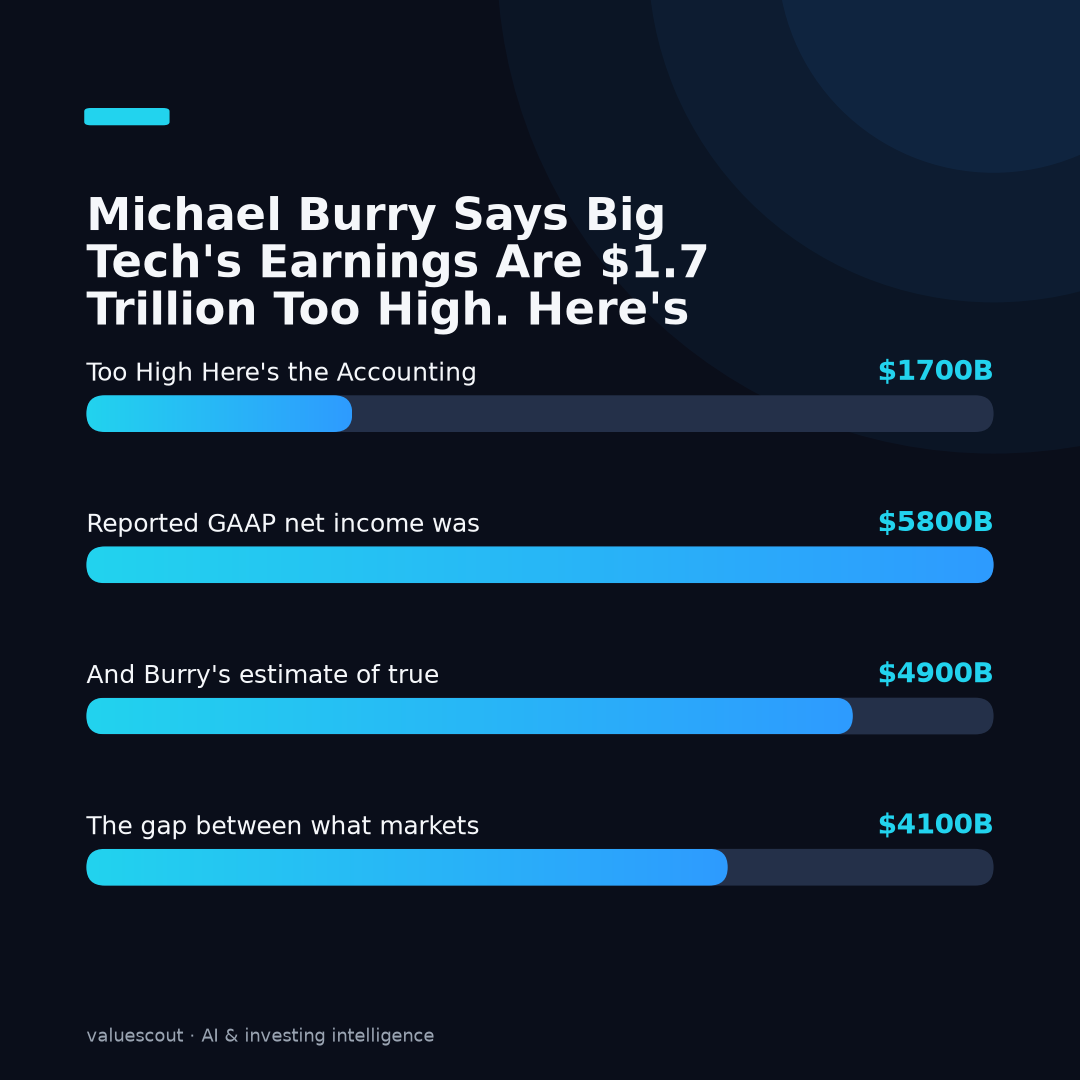
Burry analyzed more than 1,000 annual reports from 97 Nasdaq 100 companies over the decade ending in fiscal 2025. His conclusion lines up three numbers. Wall Street’s preferred “adjusted” earnings totaled about $5.8 trillion. Reported GAAP net income was about $4.9 trillion. And Burry’s estimate of true “owners’ earnings” — what’s left after the costs the headline figures gloss over — is only about $4.1 trillion. The gap between what markets are told ($5.8T) and what owners actually get ($4.1T) is roughly $1.7 trillion: his “earnings illusion.” By his math, the adjusted figure overstates the truth by about 42%, and even plain GAAP overstates it by nearly 20%. His core point isn’t an accusation of wrongdoing. It’s that the numbers everyone anchors to systematically flatter reality.
That distinction matters, so let me be precise about the engine behind the number.
Where does the $1.7 trillion come from? (It’s mostly stock-based compensation)
The single biggest driver is stock-based compensation, or SBC. When a company pays employees in shares instead of cash, GAAP rules require it to record that as a real expense — because it is one. But in the “adjusted,” non-GAAP earnings that headlines and analyst models lean on, companies routinely add SBC back, treating equity pay as if it were free. Do that across the sector for a decade and, by Burry’s math, you inflate reported profitability by close to 20% — the bulk of his $1.7 trillion figure.
Here’s why “free” is the wrong word. Paying staff in stock isn’t costless; it’s a cost paid in ownership. Every share issued to an employee dilutes existing shareholders a little more. The cash never leaves the building, so it doesn’t show up in the cash-flow line people watch — but the value transfer is real, and it lands on shareholders through dilution. SBC add-backs let a company report a number that quietly ignores that transfer.
A simple way to feel it: when a company pays a large slice of its compensation in fresh shares, its “adjusted” profit looks higher than its GAAP profit — even though the owners are now splitting the company among more shares than before. The expense didn’t disappear; it was relabeled as something investors were encouraged to look past. SBC add-backs are the most visible lever, and they alone push Wall Street’s $5.8 trillion above GAAP’s $4.9 trillion. Burry then goes a step further: when he also charges shareholders for the dilution, the buybacks companies run to offset it, and the related taxes, his estimate of true “owners’ earnings” falls to about $4.1 trillion — and that full distance from the $5.8 trillion headline is the $1.7 trillion illusion.
The companies Burry singles out are names most index investors already own: Meta, Palantir, Shopify, CrowdStrike, Datadog, Workday, Axon, Marvell, and Zscaler. Several are heavy SBC users, where equity pay is a large slice of total compensation.
Isn’t this the same as the AI capex / depreciation story?
No — and conflating them is the most common mistake. They’re two different levers that happen to flatter the same stocks.
- The SBC story (above) is about the income statement: adjusted earnings add back a real expense.
- The depreciation story — a separate warning Burry has made about AI hyperscalers — is about timing: when a company spends enormous sums building data centers, it capitalizes that spending and depreciates it slowly over years. If it stretches the depreciation schedule, near-term reported earnings look higher than the cash reality. ValueScout has covered this “deferred cost” mechanism before: cash leaves on day one, the expense arrives later.
Put them together and you get the real ValueScout takeaway: there are at least two independent accounting levers — SBC add-backs and slow depreciation — that both make the same handful of large-cap tech companies look more profitable than a strict cash-and-GAAP reading would suggest. One inflates the profit line; the other delays the cost. Neither breaks any accounting rule. Both are optional choices about how to present the same underlying business.
Why should an ordinary investor care?
Because of how modern portfolios are built. If you own a broad index fund, you own these companies at significant weight whether you chose them or not — the largest tech names dominate the major U.S. stock indexes. The valuations the whole market pays are anchored to earnings and earnings-growth expectations. If the earnings figure that powers those multiples is the adjusted one, and the adjusted one runs ~20% above GAAP, then the price-to-earnings ratio you think you’re paying is not the ratio you’re actually paying.
| | Adjusted (non-GAAP) view | Strict GAAP view | |—|—|—| | Stock-based comp | Added back (treated as “free”) | Counted as a real expense | | Reported profit | Higher | Lower | | Effective P/E at the same price | Looks cheaper | Looks more expensive | | What it ignores | Shareholder dilution | — |
The table isn’t an argument that the adjusted view is “lying.” It’s an argument that the two views answer different questions, and most investors only ever see one of them.
So what should you actually watch?
This is analysis, not advice, and nobody should trade off a single thesis. But Burry’s work points to a few habits worth adopting when you read a tech company’s results:
- Find the GAAP line, not just the adjusted one. The press release leads with “adjusted EPS.” The 10-K has GAAP net income. The gap between them is the story.
- Read SBC as a percentage of revenue and of operating cash flow. When stock comp is a large and growing share of either, “adjusted” profitability is doing a lot of work.
- Watch dilution, not just buybacks. Companies often buy back stock to offset SBC dilution. Net share count tells you whether shareholders are actually gaining ownership or just running to stand still.
- Compare capex to depreciation for the AI builders. When capital spending races ahead of the depreciation being expensed, today’s earnings are borrowing from tomorrow’s.
None of this requires an accounting degree — just the willingness to read one layer below the headline, which is exactly the edge Burry has always claimed.
Does this mean Big Tech is overvalued?
Not necessarily, and that’s the honest answer. Two things can be true at once: these are extraordinary businesses with real cash generation, and the specific number used to justify their multiples flatters the underlying GAAP reality. Burry’s critique is about the measurement, not a verdict on the businesses. A company can be worth a premium and still be reported in a way that overstates its accounting profit.
The steelman against Burry is worth stating: SBC is a non-cash item, and many investors argue it belongs in adjusted figures precisely because it doesn’t drain cash. The counter to that counter is dilution — non-cash isn’t the same as no cost. Reasonable analysts land in different places. What’s not really debatable is that the gap exists and that most market commentary quietly picks the more flattering side of it.
The bottom line
The $1.7 trillion figure isn’t a scandal headline; it’s an accounting argument about which earnings number deserves your trust. Burry’s contribution is to quantify, across a decade and a thousand filings, how far the comfortable “adjusted” number can drift from the GAAP one — mostly through stock-based compensation, with slow depreciation as a second flatter on the AI names. You don’t have to agree with his conclusion to benefit from his habit: when a company shows you two versions of its profit, the more interesting one is almost always the version it would rather you didn’t lead with.
FAQ
What is Michael Burry’s $1.7 trillion “earnings illusion”? It’s the gap between Wall Street’s adjusted earnings for 97 Nasdaq 100 tech companies over the decade through fiscal 2025 (~$5.8 trillion) and Burry’s estimate of their true “owners’ earnings” (~$4.1 trillion). Reported GAAP net income (~$4.9 trillion) sits between the two. He attributes the gap mainly to stock-based compensation add-backs, plus the dilution, offsetting buybacks, and taxes that headline figures gloss over.
Is stock-based compensation a real expense? Under GAAP, yes — it’s recorded as an expense because paying employees in shares transfers value to them and dilutes existing shareholders. Adjusted, non-GAAP figures often add it back, which raises reported profit.
Is this the same as the AI data-center depreciation issue? No. SBC add-backs inflate the profit line directly; slow depreciation of AI assets delays recognizing costs. They’re separate levers that can flatter the same companies’ earnings.
Does Burry say these stocks are a sell? His public analysis focuses on how earnings are measured, not on issuing buy or sell calls for readers. This article is educational and is not investment advice.
How can I check a company’s “real” earnings myself? Look up GAAP net income in the 10-K (not just adjusted EPS in the press release), check SBC as a share of revenue and cash flow, and watch net share count for dilution.
About ValueScout: ValueScout is an independent brand covering where artificial intelligence meets money, markets, and the economy — built to separate durable signal from cycle-driven noise. This article is for information and education only and is not investment advice.
Sources: Yahoo Finance · Moneywise · Oninvest · AOL Finance
Enjoyed this breakdown? Get the next one in your inbox.